ChromesomeHeatmapTool
ChromesomeHeatmapTool鸣谢/Acknowledgement引用/References最新更新/Updates功能/features生成图片预览/Plot example使用方法/How to use it讨论/Help&Bugs
制作:张敖 https://datahold.cn Code by Ao Zhang https://datahold.cn
鸣谢/Acknowledgement
张学才,CIMMYT,指导 Xuecai Zhang, CIMMYT, guide
陈珊,沈阳农业大学,英文翻译 Shan Chen, Shenyang Agricultral University, Translate to English
引用/References
The customized R scripts to plot the heatmap of the SNP distribution on maize chromosomes using the HapMap format input dataset were provided by Zhang et al (2022). (https://aozhangchina.github.io/R/chromesomeheatmapTool/ChromesomeHeatmap.html).
Zhang, A., Chen, S., Cui, Z. et al. Genomic prediction of drought tolerance during seedling stage in maize using low-cost molecular markers. Euphytica 218, 154 (2022). https://doi.org/10.1007/s10681-022-03103-y
最新更新/Updates
【2023-12-05】
增加了引用部分。
Added citations section.
更新问题讨论网址。
Fixed bug report URL.
【2022-05-31】
增加了英文翻译。 Added English translation.
【2022-04-21】
增加了自定义染色体大小和着丝粒位置功能。 Added features about customizing the chromosome size and position of the centromere.
增加了根据基因型数据自动适应染色体大小功能。 Added the ability to adapt to chromosome size based on genotype data automatically.
增加了白边修正功能,出现白边的可能性降低。 Added a feature to remove white edges from the plot.
【2021-05-25】
修正了未安装RIdeogram无法绘图的BUG。 Fixed a bug where the RIdeogram package could not install automatically.
修正了染色体出现NA无法绘图的BUG。 Fixed a bug where any NA on chromosomes could not generate a plot.
【2020-08-17】
增加国内线路。 China server is available.
【2020-05-29】
编写完成,选择一个HMP格式的文件即可生成图片。 Realized basic functions.
功能/features
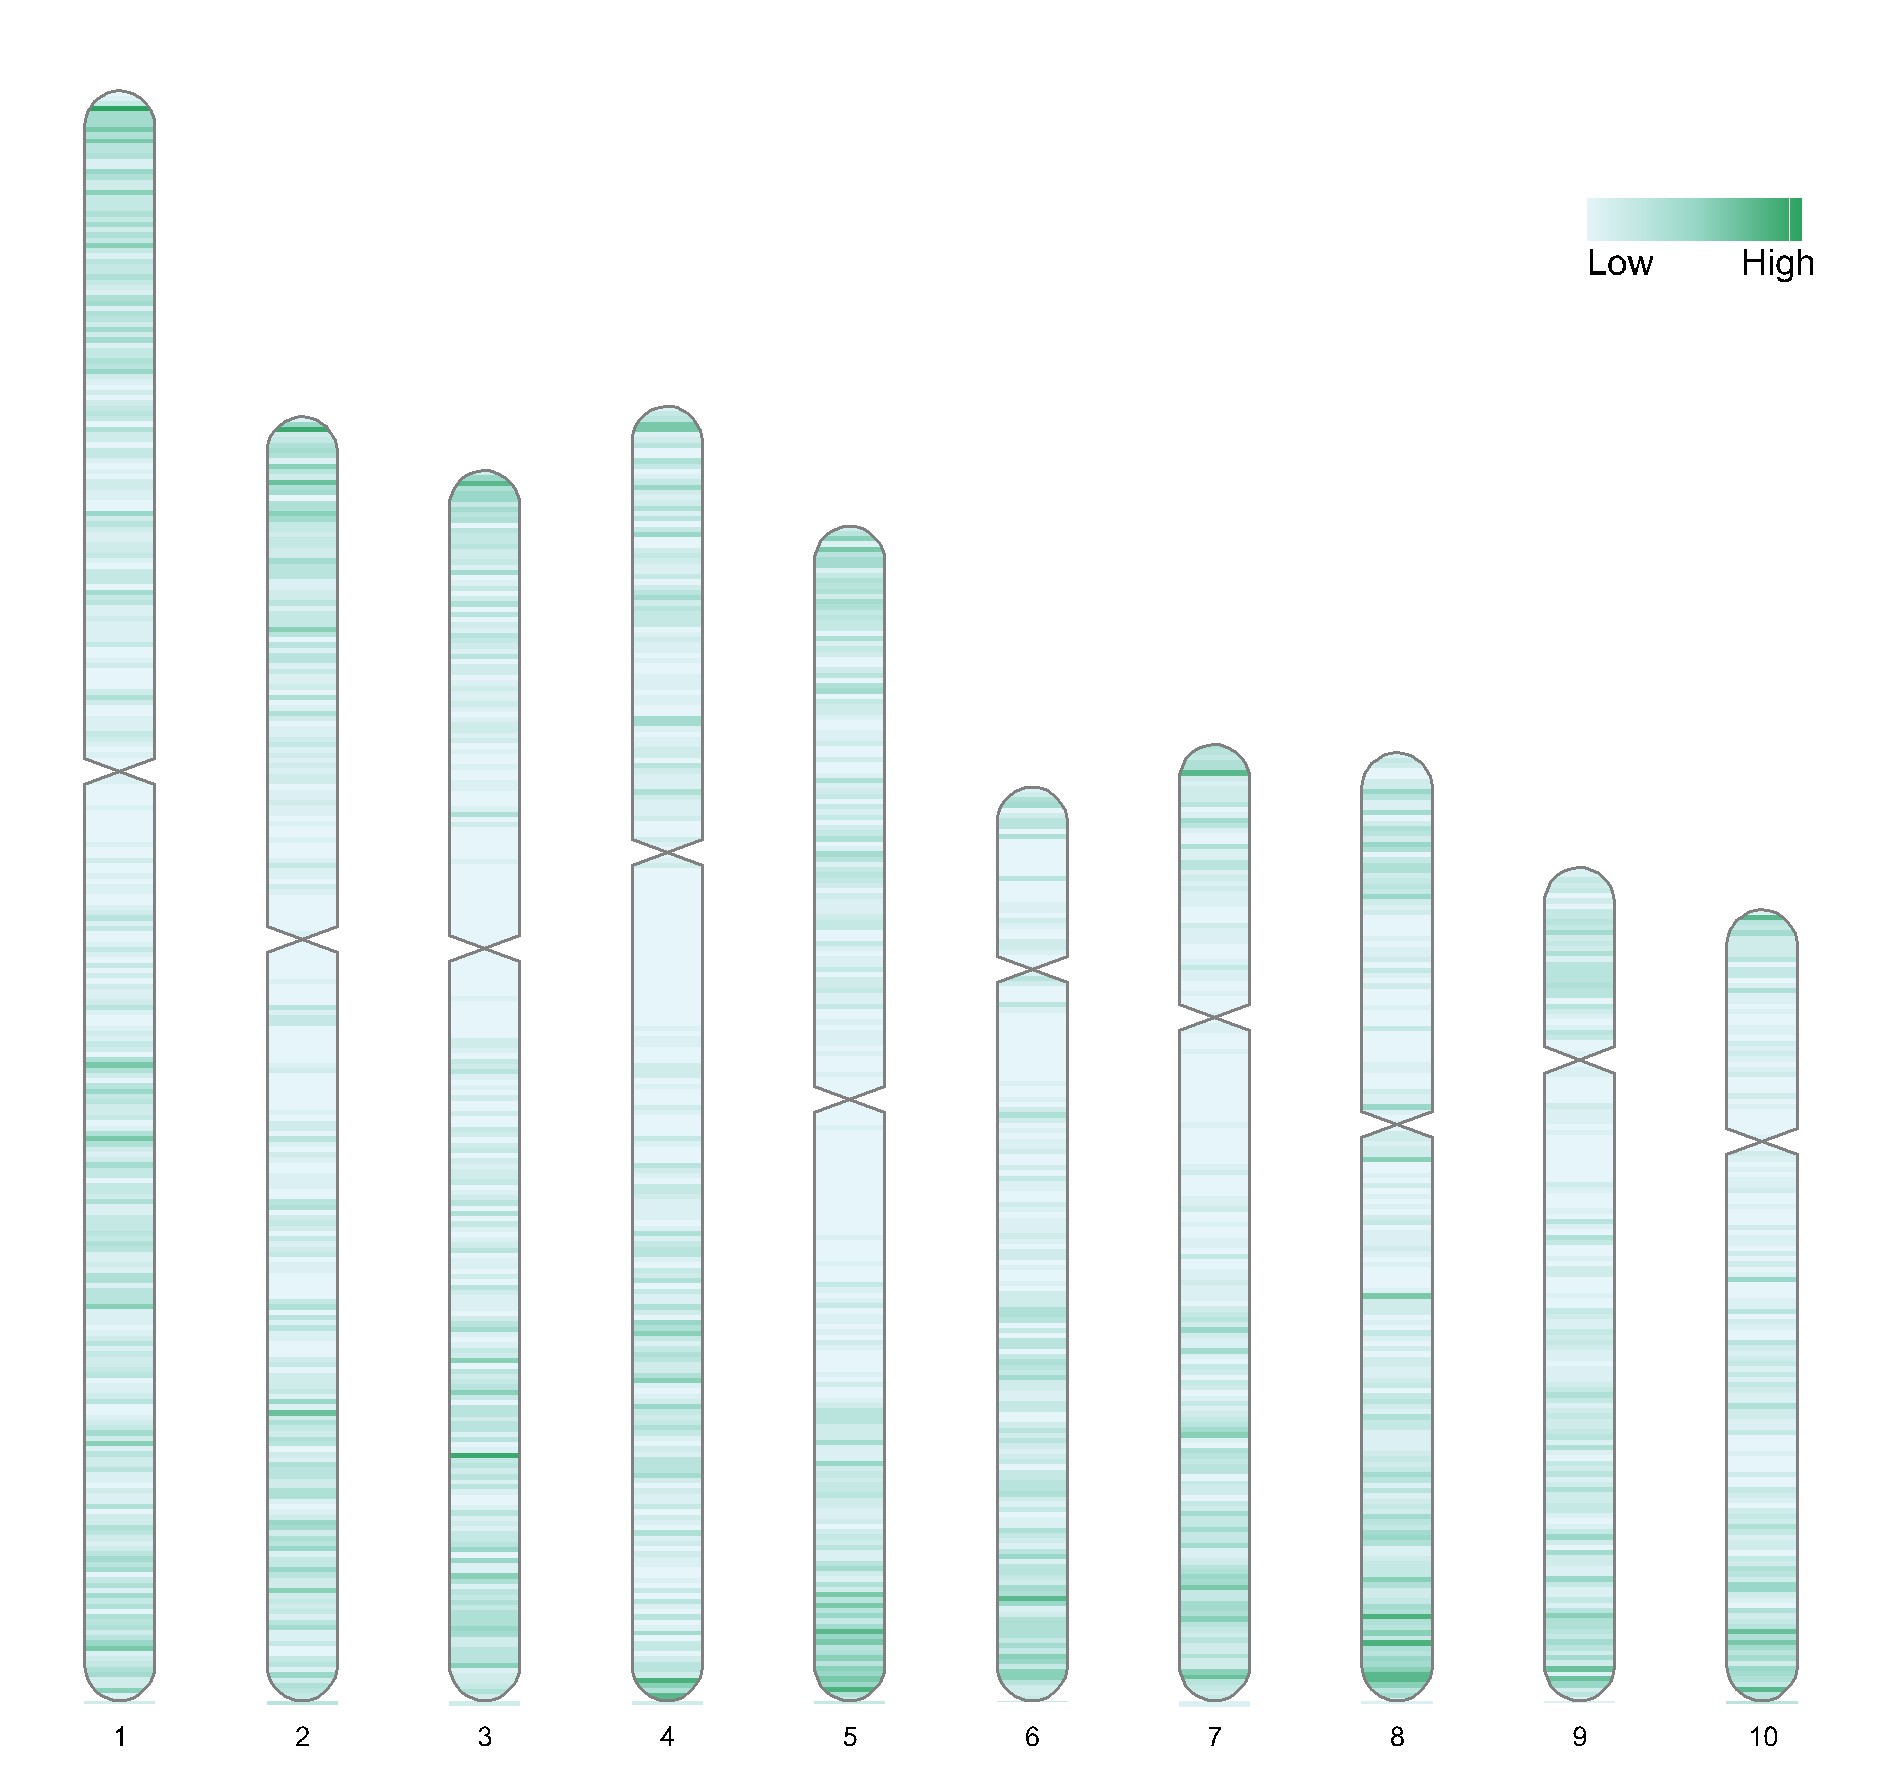
使用RIdeogram包画图,默认在输入文件所在目录生成【chromosome.svg】【chromosome.tiff】【chromosome.png】文件。 Chromesome Heatmap generating tool based on genotipic data using RIdeogram package in R programming, it could generate types of .png, .tiff, and .svg plots in the directory where the input file is located, such as [chromosome.png] [chromosome.tiff] [chromosome.svg].
chr_size <- "value"可以自定义染色体长度和着丝粒位置(需准备info_chr.txt),若无需自定义,则在选择文件时点取消。无需修改的部分写NA即可。基因组信息可以在该网站获得http://ensembl.gramene.org/Zea_mays/Location/Genome?r=10:1-1000。chr_size <- "value", then you can specify a file including parameters of the target chromosome, like info_chr.txt. You can also based on your genotypic data to get paramaters automatically, chr_size <- "auto".Chr Chr_strat Ch_end CE_ start CE_end 1 NA 307041717 NA NA 2 NA 244442276 NA NA 3 NA 235667834 NA NA 4 NA 246994605 NA NA 5 NA 223902240 NA NA 6 NA 174033170 NA NA 7 NA 182381542 NA NA 8 NA 181122637 NA NA 9 NA 159769782 NA NA 10 NA 150982314 NA NA 暂不支持其他基因组的绘制。 Only the maize genome is supported so far. Updates from time to time.
生成图片预览/Plot example
使用方法/How to use it
将下列代码复制到Rstudio,根据需要,自行修改下面代码的第二、三行,全选运行。
Please use the windows system, because some functions only available in the windows environment. Please copy the following code into Rstudio and modify the second and third rows according to your needs. Slecet all and run them. The first popupWindow, please choose a file of HapMap format, if the chr_size <- "value", you should select a info_chr.txt file to specify chromosome information.
海外: Overseas:
rm(list=ls())plotcolor <- c("#4575b4", "#ffffbf", "#d73027") #? You can change colors here, like c("#e5f5f9", "#99d8c9", "#2ca25f")chr_size <- "value" # "value" represents the chromosome size or centromere position were specified by user; "auto" represents automatically estimate those informationsource("https://aozhangchina.github.io/R/chromesomeheatmapTool/chromesomeheatmap.r") # import the script, network connection required国内: China:
xxxxxxxxxxrm(list=ls())plotcolor <- c("#4575b4", "#ffffbf", "#d73027") #? 颜色 c("#e5f5f9", "#99d8c9", "#2ca25f")chr_size <- "value" # "value"表示给定的值,即参考基因组给定大小;"auto"表示根据基因型自己设置值。source("https://dataholdcn.cn/R/chromesomeheatmapTool/chromesomeheatmap.r") # 加载程序文件,需要联网r讨论/Help&Bugs
国内用户请提交Bug或使用中有任何问题,请发邮件到张敖的邮箱。或者在chromesomeheatmapTool - lecent.wang 上讨论,我们定期查看。
User in China, please send an e-mail to Ao Zhang to submit a bug. Or please to reply this post chromesomeheatmapTool - lecent.wang to discuss any questions about the linkage disequilibrium decay and plot.