LDdecayPlotTool
LDdecayPlotTool鸣谢/Acknowledgement引用/Citation最新更新/Updates功能/features生成图展示/Showing the plot of examples均值图像/the average LD Decay plot across all chromosome分染色体图像(显示r^2)/the LD plot with a r^2^ value for each chromosome.分染色体图像(不显示r^2)/the chromosomes plot without a r^2^ value生成表展示/Showing the example of tables使用方法/How to use it讨论/Help&Bugs
制作:张敖 https://datahold.cn Code by Ao Zhang https://datahold.cn
鸣谢/Acknowledgement
张学才,CIMMYT,指导 Xuecai Zhang, CIMMYT, guide
曹士亮 ,黑龙江农科院,测试玉米基因组 Shiliang Cao, Heilongjiang Academy of Agricultural Sciences, testing maize genome
袁一冰,四川省农科院,测试玉米基因组 Yibing Yuan, Sichuan Academy of Agricultural Sciences, testing maize genome
宋俊乔,安阳市农科院,测试玉米基因组 Junqiao song, Anyang Academy of Agricultural Sciences, testing maize genome
冉虎,印度农业研究院,测试小麦基因组 Rahul, India Agricultrual Research Institute, testing wheat genome
陈珊,沈阳农业大学,译成英文 Shan Chen, Shenyang Agruicultural University, translate into English
瞿静涛,上海农科院,测试特种玉米基因组 Jingtao Qu, Shanghai Academy of Agricultural Sciences, testing waxy maize and sweet m;aize genomes
引用/Citation
Linkage disequilibrium analysis was performed using TASSEL software and then the visualization of LD decay was ploted by the R programing integrated script provided by Zhang et al (2022).
Zhang, A., Chen, S., Cui, Z. et al. Genomic prediction of drought tolerance during seedling stage in maize using low-cost molecular markers. Euphytica 218, 154 (2022). https://doi.org/10.1007/s10681-022-03103-y
最新更新/Updates
【2023-12-29】
增加了引用。 Added citation.
【2022-06-07】
增加了英文翻译。 Added English translation.
【2020-08-17】
增加了国内线路。 China server is available.
【2019-10-29】
增加了对小麦基因组的支持。理论上,适合任何基因组的绘制。可能需要多次调节参数。 Support wheat genome. Theoretically, it can support any plant.
增加了错误返回值,用于判断如何设置LD阈值。 Added return value of error to select LD threshold.
【2019-10-08】
修正了有时刻度显示不全的BUG。 Fixed the bug of incomplete display of coordinate axis scale.
修正了有时单位显示错误的BUG。 Fixed the bug of the unit may be incorrect.
【2016-11-23】
完善x轴刻度。 Improved the scale of X axis.
【2016-11-21】
可选择单位kb或bp。 Added options of KB and BP units.
在图像中心输出r^2^值。 Added r^2^ value in the center of plot.
去掉ggplot2包,完全使用基础绘图功能,提高兼容性。 No longer use ggplot2 package, improving compatibility.
完善细节。 improved details.
【2016-11-09】
在图中标出LD平均LD衰减值。 Added average LD decay in the
为每一个chr计算LD衰减值,并输出在表LDDecayChr.csv中。 Outputing LD decay value into a file named LDDecayChr.csv.
去掉分染色体LD衰减图的背景及网络线。 Removed background and network lines in the
【2016-11-02】
增加简单线性方程计算,获得比较精确的LD衰减值,仅供参考。 Using Simple Linear Equation to calculate the LD decay value.
【2016-10-31】
增加分染色体画图。 Added the plot of each chromosome.
增加图例。 Added the legend.
【2016-10-26】
根据衰减阈值,画出局部衰减图。 According to the attenuation threshold, draw a local attenuation map
增加参数自定义。 Added custom permeters.
【2016-10-21】
雏形完成,直接读取TESSEL的LD分析文件进行画图。 Using the result of TASSEL to draw a plot of LD decay.
功能/features
直接利用TASSEL的LD分析生成的文件。 The LD decay plot can be drawn directly using the files generated by the LD analysis of TASSEL.
生成整体的LD衰减图(自行保存为PDF、TIFF、JPG、PNG等格式)。 Generate the overall LD decay map (can be saved as PDF, TIFF, JPG, PNG, etc.).
生成每条染色体及总体均值的LD衰减图(可自行保存为PDF、TIFF、JPG、PNG等格式)。 Generate the LD decay map of each chromosome and the overall mean (can be saved as PDF, TIFF, JPG, PNG, etc.)
生成可供Excel画图的表格(文件名:群体名称+LD Decay Plot .csv)。
Generate a table for Excel to plot (file name: population name + LD Decay Plot .csv).
快速读取大文件,1.4G文件1min内读取完毕。 Quickly read large files, a 1.4G file can be improve within 1min.
根据简单线性模型,估算比较精确的LD衰减值。 Using Simple Linear Equation to calculate the LD decay value.
生成图展示/Showing the plot of examples
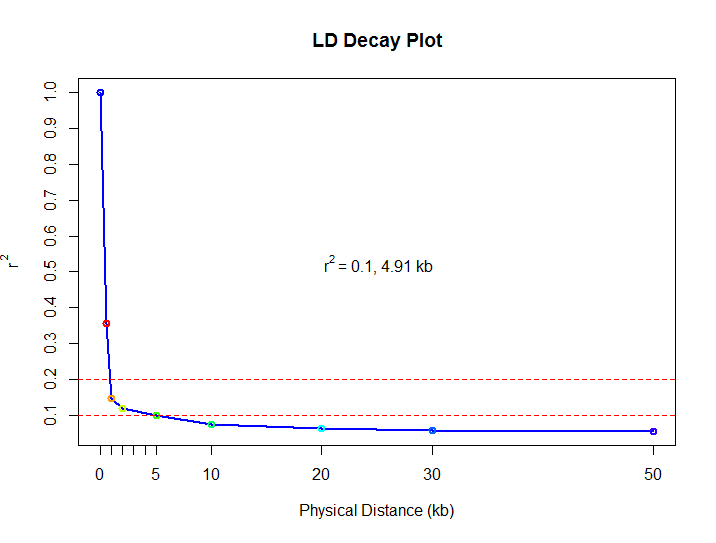
均值图像/the average LD Decay plot across all chromosome
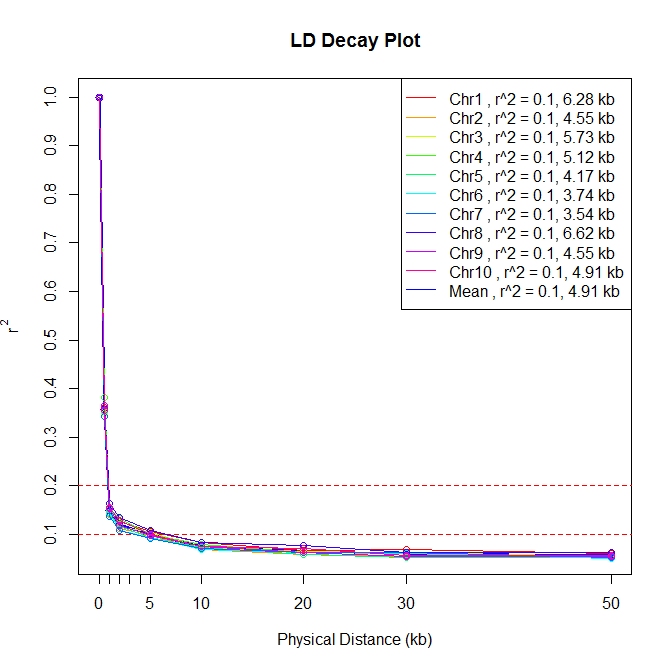
分染色体图像(显示r^2)/the LD plot with a r^2^ value for each chromosome.
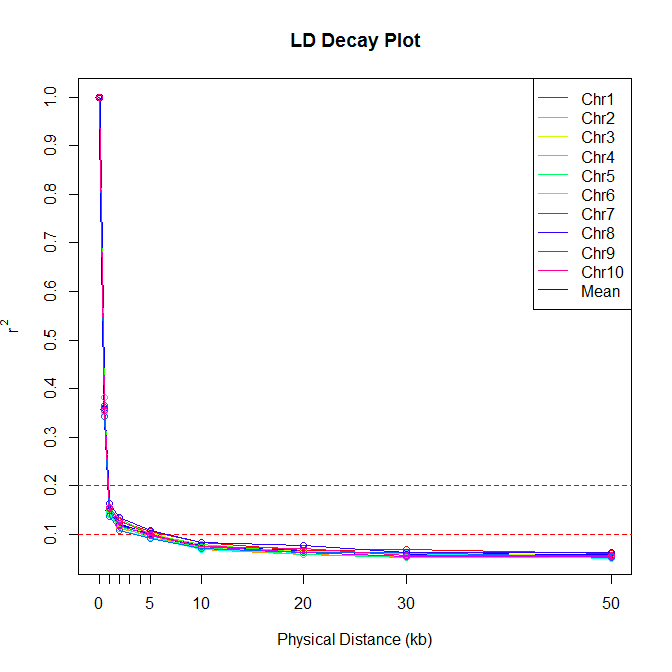
分染色体图像(不显示r^2)/the chromosomes plot without a r^2^ value
生成表展示/Showing the example of tables
| Scale Distance (kb) | Chr1 | Chr2 | Chr3 | Chr4 | Chr5 | Chr6 | Chr7 | Chr8 | Chr9 | Chr10 | Mean |
|---|---|---|---|---|---|---|---|---|---|---|---|
| 0 | 1 | 1 | 1 | 1 | 1 | 1 | 1 | 1 | 1 | 1 | 1 |
| 0.5 | 0.36 | 0.35 | 0.35 | 0.38 | 0.36 | 0.35 | 0.34 | 0.36 | 0.36 | 0.36 | 0.36 |
| 1 | 0.16 | 0.14 | 0.15 | 0.15 | 0.14 | 0.14 | 0.14 | 0.16 | 0.15 | 0.16 | 0.15 |
| 2 | 0.13 | 0.11 | 0.12 | 0.13 | 0.12 | 0.11 | 0.11 | 0.13 | 0.12 | 0.13 | 0.12 |
| 5 | 0.11 | 0.1 | 0.1 | 0.1 | 0.09 | 0.09 | 0.09 | 0.11 | 0.1 | 0.1 | 0.1 |
| 10 | 0.08 | 0.07 | 0.07 | 0.08 | 0.07 | 0.07 | 0.07 | 0.08 | 0.08 | 0.08 | 0.08 |
| 20 | 0.07 | 0.06 | 0.07 | 0.06 | 0.06 | 0.06 | 0.06 | 0.08 | 0.06 | 0.07 | 0.06 |
| 30 | 0.07 | 0.05 | 0.06 | 0.06 | 0.05 | 0.06 | 0.06 | 0.06 | 0.05 | 0.06 | 0.06 |
| 50 | 0.06 | 0.05 | 0.06 | 0.06 | 0.05 | 0.05 | 0.05 | 0.06 | 0.06 | 0.06 | 0.06 |
| Chromosome | LD Decay Distance (kb) |
|---|---|
| Chr1 | 6.28 |
| Chr2 | 4.55 |
| Chr3 | 5.73 |
| Chr4 | 5.12 |
| Chr5 | 4.17 |
| Chr6 | 3.74 |
| Chr7 | 3.54 |
| Chr8 | 6.62 |
| Chr9 | 4.55 |
| Chr10 | 4.91 |
| Mean | 4.91 |
使用方法/How to use it
推荐将所有文件(包括r文件和LD衰减文件)放在同一个目录下,然后在R Studio中运行下列代码。 Please put all the files in the same folder. Then run the following code in the Rstudio software.
海外: Overseas:
rm(list=ls()) # Clear the Environment VariablescoordinateScale <- c(0, 500, 1000, 2000, 5000, 10000, 20000, 30000, 50000) # x coordinate axis, unit is bpunit <- "Kb" # Units on the image: "Kb" or "bp"pop.name <- "DTMA" # The population's name plotTitle <- "LD Decay Plot" # The title of plot lineWidth <- 2 # the width of line lineColor <- "blue" # The color of line #lineColor <- "blue","brown","green","gray","gold","darkblue","lightblue","red","orange","tan","yellowgreen") # The color of line dot <- "o" # "o" is true, "l" is false dottedLine <- TRUE # TRUE or FALSE dividingLine <- c(0.1) # 0.1 or 0.2 or c(0.1,0.2)plotChrR2 <- TRUE # R^2 value display, TRUE represents yes, and F means no.source("https://aozhangchina.github.io/R/LDdecay/LDdecayV4.r",encoding = "utf-8") # the internet is required.国内: China:
xxxxxxxxxxrm(list=ls()) # Clear the Environment Variables 清空环境变量 coordinateScale <- c(0, 500, 1000, 2000, 5000, 10000, 20000, 30000, 50000) # x coordinate axis, unit is bp 坐标x轴,按照pb填写unit <- "Kb" # Units on the image: "Kb" or "bp" 图像单位pop.name <- "DTMA" # The population's name 群体名称plotTitle <- "LD Decay Plot" # The title of plot 图表标题lineWidth <- 2 # the width of line 线宽lineColor <- "blue" # The color of line 线颜色#lineColor <- "blue","brown","green","gray","gold","darkblue","lightblue","red","orange","tan","yellowgreen") # The color of line 线颜色dot <- "o" # "o" is true, "l" is false 线型:"l"是折线,"o"是带点的折线dottedLine <- TRUE # TRUE or FALSE dividingLine <- c(0.1) # 0.1 or 0.2 or c(0.1,0.2)plotChrR2 <- TRUE # R^2 value display 全染色体图例中是否显示r^2值,TURE:显示,FLASE:不显示source("https://dataholdcn.cn/R/LDdecay/LDdecayV4.r",encoding = "utf-8") # 加载程序文件,需要联网然后选择LD数据文件,如:allLD.csv。 Choose a LD file, like [allLD.csv].
程序自动运行直至全部完毕。 Please wait for the program to complete running automatically.
最后一行会显示估算的比较精确的LD衰减值,并显示两个图像。 The last line of console will give you a reference value of LD decay. You can also get plots.
讨论/Help&Bugs
用户请提交Bug或使用中有任何问题,请在lecent.wang上讨论,我们定期查看。
Users please to reply this post (lecent.wang) to discuss any questions about the linkage disequilibrium decay and plot.